In comparison to recent years, the first half of 2006 has been relatively quiet with respect to major catastrophes. Over the past five months, Indonesia has borne the brunt of natural disasters, suffering a number of significant flood events, along with two earthquakes close to the south coast of Java. Together, these took close to 7,000 lives, during the first - in May - as a result of building collapse due to severe ground shaking, and in the second - in July - as a consequence of a tsunami. Total losses are estimated at more than US$3 billion*. Another strong earthquake shook western Iran in March, taking just 66 lives, but causing massive damage, while further lethal but small quakes struck Mozambique in February and Indonesia in March.
Apart from Tropical Storm Alberto, which made landfall in Florida in early June without causing substantial damage, the Atlantic hurricane season has so far been quiet - perhaps ominously so, given forecasts for another active season. The worst windstorm of the period was undoubtedly Cyclone Larry, which battered the Australian state of Queensland in March, causing economic losses estimated at around $1.1 billion, with insured losses of around $225 million.
The less windy, but unusually wet, Tropical Storm Bilis (also known as Typhoon Florita), however, led to the largest storm losses for the period, contributing to more than 600 deaths and leaving a repair bill, in China, of close to $2 billion, primarily due to floods. A number of other major flood events also afflicted China, killing a further 310 and creating losses totalling $1 billion.
Record rainfall levels in June also led to massive flooding in the north eastern states of the United States, notably Pennsylvania, New York, New Jersey, Maryland, Delaware, Virginia and Washington DC, with 16 deaths and economic losses around the $1 billion mark. Many other countries were also affected by serious flooding, most notably, Germany, Austria, the Czech Republic, Hungary, Bulgaria, Romania, Serbia, Croatia, Montenegro, Slovakia and Russia in Europe, Chile and Ecuador in South America, Kenya and the Democratic Republic of Congo in Africa, and Japan, Taiwan, Indonesia, the Philippines, India, Bangladesh, Thailand and Iran in Asia.
A number of technological disasters occurred during the period, most notably the fire on board the containership Hyundai Fortune in March. It is widely expected to be the largest ever cargo loss.
The most lethal manmade events involved an oil pipeline explosion in Nigeria and terrorist train bombs in Mumbai (India), each taking around 200 lives. Other notable events included the capsizing of ferries off Bahrain and Djibouti, a rail crash in Valencia (Spain) and a fire at an electronics fair in India.
TERRITORY: INDONESIA
Region: Java
Date: 17 July 2006
Event: Tsunami
Impact: As of 21 July, the death toll stood at 533, with 308 missing and close to 1,000 injured. The number of displaced persons is set at 61,352, the great majority from the towns of Ciamis (more than 43,000) and Tasikmalaya (over 12,000), and the balance from Cilacap and Kebumen. The total number of buildings destroyed or severely damaged is put at more than 1,000, with over 1,500 fishing boats destroyed, heavily damaged or swept away. Infrastructure is also badly affected, with five bridges destroyed and more than 12 km of road lost.
Summary: A moment magnitude 7.7 submarine earthquake occurred close to the south coast of Java at 15.24 local time, near the junction between the Australian Plate to the south and the Sunda Plate to the north. The USGS placed the quake at the relatively shallow depth of 48.6 km, and at a location 240 km SSW of the city of Tasikmalaya, and 358 km south of the capital Jakarta. More than 20 aftershocks followed the main shock, with two exceeding magnitude 6.
The main quake triggered a tsunami that impacted along a 200 km stretch of West Java's south coast, in the region of the beach resort of Pangandaran. Wave height estimates range upwards from 2 m to 7 m, with reported inundation distances of up to 800 m inland in places. A similar earthquake in the region in 1994 generated a tsunami up to 13 m high that took more than 200 lives. The Pacific Tsunami Warning Centre in Hawaii issued a tsunami warning 12 minutes after the earthquake, but no warning was transmitted to the threatened areas by Indonesian authorities. The tsunami arrived at the coast around 55 minutes after the earthquake.
DATA SOURCES:
USGS Earthquake Hazards Program earthquake.usgs.gov
ReliefWeb www.reliefweb.int
Additional sources:
The Jakarta Post
Image: Image from the IKONOS satellite shows the 'tide mark' of debris left following retreat of the Java tsunami.
TERRITORY: AUSTRALIA
Region: Queensland
Date: 20 March 2006
Event: Cyclone
Impact: The worst effects of Cyclone Larry were centred upon the small town of Innisfail (population (approx) 8,500) 90 km south of Cairns. Despite severe damage to buildings, including the loss of around 50% of roofs, no fatalities occurred. In total, around 10,000 buildings in Innisfail were damaged, leaving thousands homeless. A quarter of government buildings were also damaged, and many roads and bridges made impassable. At Babinda, 30 km north of Innisfail, an estimated 80% of buildings were damaged, along with virtually all homes at neighbouring Silkwood, which was the worst hit settlement. Around a third of properties at Kurrimine Beach and Mission Beach were also damaged, but the city of Cairns escaped lightly. Cairns airport and harbour were closed, however, and more than 50,000 residents in the area lost power. The banana industry, which provides around 6,000 jobs, was severely affected, with the level of crop destruction reported to be as high as 90%, and losses estimated at more than $255 million. Australia also lost 10% of its sugar production due to the cyclone, with resulting losses set at around $145 million. Total economic losses are forecast to be about $1.1 billion, with insured losses hovering around $225 million.
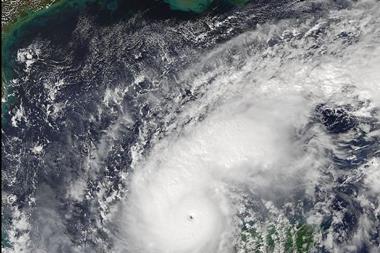
Summary: Tropical Cyclone Larry started life as a low pressure system over the Coral Sea on 16 March. Two days later, and 1150 km off the Queensland coast, the system had developed into a category 2 cyclone (on the Australian Intensity Scale). The storm intensified to category 5 on the AIS, and made landfall on the Queensland coast close to Innisfail, between 06.20 and 07.20 h on 20 March. Ten minute sustained wind speeds are estimated at (approx) 200 km an hour, with gusts as high as 290 km and hour - and perhaps up to 320 - close to Innisfail. Maximum wind speeds are typical of a category 4 storm on the Saffir-Simpson Scale for Atlantic hurricanes, although the lowest pressure, at 915 mb, is more characteristic of a Category 5 Atlantic hurricane. Larry was downgraded to a tropical low pressure system as it headed inland, before dissipating over the next 24 hours. This short lived but extremely intense storm is the most powerful to strike the Queensland coast since 1931.
DATA SOURCES:
Tropical Cyclone Larry Review
Guy Carpenter www.guycarp.com
Australian Bureau of Meteorology, Queensland Regional Office www.bom.gov.au
Additional sources: The Australian
Image: Tropical Cyclone Larry bearing down on Queensland on 19 March, imaged by the MODIS instrument on the TERRA satellite. Courtesy: Jeff Schmaltz, MODIS Rapid Response Team, NASA Goddard Space Flight Centre.
TERRITORY: PHILIPPINES, TAIWAN, CHINA
Region: Respectively, Luzon, northern Taiwan and SE China
Date: 8 - 15 July 2006
Event: Tropical Storm Bilis (Typhoon Florita)
Impact: While maximum wind speeds barely reached the level of a category 1 tropical cyclone, the particularly heavy rains associated with Tropical Storm Bilis resulted in considerable damage and loss of life, and qualified Bilis as the most damaging storm - so far - of 2006. Although Bilis did not make landfall in the Philippines, the country suffered the strongest winds and heaviest precipitation as the storm passed to the north. The outer rain bands brought torrential rain to central Luzon, including the capital Manila, killing nine in flash floods and landslides. Four people were killed in Taiwan, although damage here was relatively light due to less in the way of sustained heavy rainfall.
China bore the brunt of the storm, with latest estimates (24 July) putting the death toll at 612, with more than 200 missing, and over 3 million displaced. Serious flooding affected the provinces of Fujian, Guangxi, Guangdong, Yunnan, Zhejiang, and floods and wind caused travel disruption in the city of Shanghai. The province of Hunan was worst affected, with massive flooding and landslides destroying an estimated 31,000 homes and claiming more than 400 lives. Rainfall measurements in China indicated hourly precipitation rates of up to 11 cm, and this - combined with the persistence of Bilis - is blamed for the severe flooding in the south-east of the country. Total economic losses are currently (end July) estimated at $1.98 billion, but can be expected to rise. Insured loss data are not currently available.
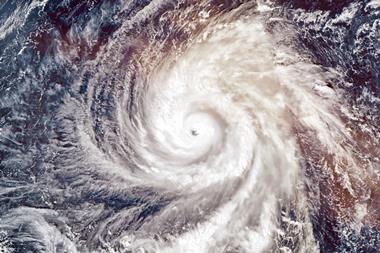
Summary: Tropical Storm Bilis began life on 7 July, as a tropical disturbance south of Guam in the western Pacific. By the following day, the disturbance had organised itself into a tropical depression, and by the 9th achieved tropical storm status. Bilis headed north west towards Taiwan and was classified as a severe tropical storm on 11 July. Two days later, Bilis reached peak intensity, with wind speeds reaching 110 km an hour, before making landfall in northern Taiwan.
After crossing the island, Bilis made a second landfall in China's Fujian province on the 14th. The storm weakened to a tropical depression over SE China the following day, and to a remnant low the day after. Thereafter, Bilis moved slowly westwards and bringing very heavy rains to inland China.
DATA SOURCES:
ReliefWeb www.reliefweb.int
Dartmouth Flood Observatory www.dartmouth.edu
Image: The Tropical Rainfall Measuring Mission shows Bilis passing to the north of the Philippines on 10 July with the heaviest rain concentrated south of the storm centre. Courtesy: Hal Pierce (SSAI/NASA GSFC)
TERRITORY: INDONESIA
Region: Java
Date: 27 May 2006
Event: Earthquake
Impact: Around 5 million people live within 50 km of the epicentre. It is not surprising, therefore, that despite its relatively small size, the impact of the earthquake was severe. Final estimates put the death toll at 5,778, with more than 37,883 injured. Over 140,000 homes were completely destroyed, and a further 468,000 damaged. Total economic losses are estimated to be in excess of $3.1 billion.
Summary: At 05.54 local time, a magnitude 6.3 earthquake struck the south coast of Java close to the towns of Galur and Bantul, some 10 - 15 km SSE of the city of Yogjakarta and 455 km ESE of the Indonesian capital, Jakarta. At a depth of around 17 km, the earthquake was shallow, occurring within the Sunda Plate that overlies the Australian Plate, which is subducting beneath it to the south of Java. The quake was felt across much of Java and also in the island of Bali to the east. Blitar, and II at Surabaya. Hundreds of aftershocks, with magnitudes up to 5.2 occurred in the weeks following the main shock, but no tsunami was reported.
DATA SOURCES:
USGS Earthquake Hazards Program earthquake.usgs.gov
Reliefweb www.reliefweb.int
TERRITORY: UNITED STATES
Region: Maryland, Pennsylvania, Delaware, Virginia, New York, New Jersey, Washington DC.
Date: 25 June - 1 July 2006
Event: Flood
Impact: Widespread flooding across Virginia, Washington DC, Maryland, Pennsylvania, Delaware, New Jersey and New York State, damaged tens of thousands of buildings and temporarily displaced hundreds of thousands of people. On the Susquehanna River in Pennsylvania, 200,000 people were evacuated as the river exceeded its flood stage, but were allowed to return when levees successfully held the flood crest conditions. In New York State, eastern and central areas were worst affected, including the city of Binghamton on the Susquehanna, where more than 15,000 were evacuated. Property damage in the state is estimated at (approx) $100 million.
In New Jersey, Trenton on the Delaware suffered major flooding, as the river burst its banks and flood waters reached close to 2 m depth. Six thousand residents were forced to flee and thousands of homes were inundated. In Montgomery County, Maryland, rising floodwaters on the Susquehanna forced out 2,000 people, while in Washington DC, many highways and government buildings were flooded, including the Justice and Commerce departments and the Internal Revenue Service (IRS), which was expected to remain closed for a month. The Washington Metro was disrupted, and Amtrack services halted, while tens of thousands lost power across the region. The final death toll is estimated at 16, with economic losses due to the flooding set at around $1 billion. Insured loss data are not currently available.
Summary: Between 22 and 28 June, the Mid-Atlantic and north eastern states experienced exceptionally heavy precipitation as a result of a mass of tropical air from the Atlantic pushing north west into a stationary front located over the region. The result was four or five days of severe thunder storms, many of which continually reformed to repeatedly dump torrential rain across the same areas. In places, rainfall exceeded 25 cm, breaking many records. In Washington DC and Columbia (Maryland), 15 - 22 cm of rain fell within 24 hours, closing federal buildings and dozens of roads in the capital and carrying vehicles away in flash floods. At least 10 cm of rain fell across most of the Delaware River Basin, with up to 32 cm in places. Near record flood conditions occurred along the Delaware River on the 28th and 29th. In Pennsylvania, the Susquehanna River reached dangerous levels after more than 20 cm of rain fell, and floodgates had to be opened to prevent uncontrolled overtopping of the banks. River levels were above their flood stages in many places, including Wilkes-Barre, Danville and Harrisburg on the Susquehanna, and Phillipsburg and Trenton on the Delaware. The Susquehanna River was reported at one point to be nearly 5 m above flood level, with the Delaware around 10 m above flood level in places.
DATA SOURCES:
Dartmouth Flood Observatory www.dartmouth.edu/floods/
Delaware River Basin Commission
www.state.nj.us/drbc/Flood_Website/2006/summary7-17.pdf
Additional sources: NOAA North East River Forecast Center
www.erh.noaa.gov/er/nerfc/
Image: Precipitation over the north eastern United States in the seven days to 28 June 2006. Courtesy NOAA.

