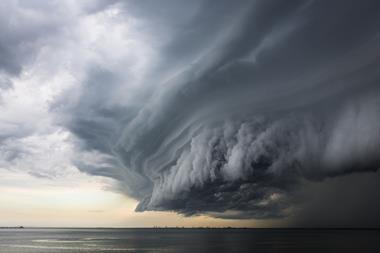
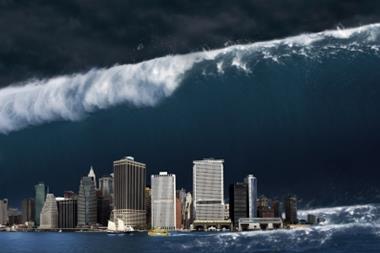
Relatively light hurricane activity in the decade preceding 2004 lead to a lack of focus on the offshore energy market in the Gulf of Mexico. (See Figure 1.) The destructive impact of the 2004/2005 seasons has changed that perception for good. Accurate modelling of offshore energy risks due to hurricanes has become an urgent and practical matter for risk managers in the oil and gas and risk finance industries.
Offshore energy risk from hurricanes is distinct from other property risks. Translating natural catastrophe risk modelling techniques to the offshore energy market needs a focus on the risk being modelled. Offshore energy risks do have significant property exposures to platforms, wellheads and pipelines, but a large component of the risk in the offshore energy market is continuous production. Modelling pipeline flows through networks requires the acquisition of large volumes of data regarding pipeline sizes, traverses and information about valves etc.
Measuring offshore hurricane risks presents many unique design challenges to catastrophe modellers from an engineering standpoint. Hurricanes cause severe damage to platform support structures, equipment, pipelines and other industry infrastructure. However, a significant fraction of hurricane damage is indirect impact through the extraordinarily high waves and powerful currents they create. EQECAT and other engineering modelling firms have been assessing post-catastrophe network reliability states for years, and when these models are combined with the available information they can become effective forecasting tools for risk managers and insurers.
Two bad years
The 2004 and 2005 hurricane seasons caused unprecedented damage and losses to the Gulf of Mexico energy market. In 2004, Hurricane Ivan produced record level wave heights and wind speeds that exceeded the 100 year design criteria for surface structures, and created high levels of pipeline damage, many resulting from mudslides and excessive movement in the Mississippi Delta region.
In 2005, hurricanes Katrina and Rita caused significant damage to the oil and gas production structures in the Gulf of Mexico, with estimates by US Minerals Management Service (MMS) stating that roughly 3,050 of the 4,000 platforms and about 22,000 of the 33,000 miles of offshore pipelines were in the path of these two hurricanes. Additionally, onshore damage significantly hampered the ability of the oil and gas industry to respond, due to lack of resources, personnel and infrastructure.
Hurricanes Katrina and Rita caused major disruption to the oil and gas facilities in the Gulf. Among other impacts, Hurricane Katrina resulted in an immediate 8.8 MMscf/day reduction in natural gas supply. Less than a month later, with 44% of the offshore production not yet returned to operations, Hurricane Rita struck. Hurricane Rita took out almost 3.5% of the annual US natural gas production as a result of damage to the gas infrastructure and associated facilities.
Insured losses for the three storms together (Rita, Katrina and Ivan) reached about $7 billion, according to the Willis Energy Market Report. Most of this loss resulted not from physical damage, but exposures like business interruption (BI) and contingent business interruption (CBI). In the case of Hurricane Ivan, about two-thirds of its losses came from BI and CBI. Therefore, these are extremely important coverages and need to be modelled with as much understanding and accuracy as possible.
Measuring risk in the Gulf of Mexico
The last few hurricanes to hit the Gulf of Mexico have highlighted that the direct cause of damage to platforms is the indirect waves generated by the storm, and not direct damage due to winds. The wind has a much smaller impact, causing damage to near-shore and onshore assets. Offshore, purely wind driven damage affects topside equipment and facilities, and this is generally not as severe as wave related damage.
In addition to structural damage from wave loads, indirect waves also damage appurtenances (for example, boat landings) that are not structural but necessary for access to the platform. Waves also result in damage to equipment or riser/conductors that will stop production.
Those facilities most at risk from strong wave action are the older, fixed structures that populate the shallower areas of the gulf. Figure 2 shows the age distribution for the roughly 3,800 fixed structures in the gulf. Almost 40% of the fixed structure fleet is over 20 years old (the typical design life for offshore facilities), and 21% is over 30 years old.
Although most of the oil and gas production in the Gulf does not come from these older, higher risk facilities, the pipeline system that carries all offshore production to onshore terminals does depend on many older facilities. Therefore, a more productive, more modern facility may survive a storm relatively unscathed, but its production may be shut-in due to the destruction of a more vulnerable facility downstream through which the production flows. This is the essence of contingent business interruption.
Another factor affecting losses to Gulf assets is the limited resources available for post-storm cleanup and repairs. The storms that disrupted operations in 2004/2005 affected wide areas of operations, straining the available resources so that even relatively minor repairs could take two or three times the normal time to complete, which added to the BI and CBI costs.
Data availability for modelling
Natural catastrophe models can be generalised into three basic components: the hazard component, the damage calculation and the loss component. The most basic step in creating and using a catastrophe model is to know where the risk lies. This requires an understanding of the hazard and exposure data as well as the other information available.
Hazard data
The primary hurricane hazard to fixed assets in the Gulf of Mexico is wave height. The wave height is important because of the way that the platforms are constructed: the topside assets are elevated above the expected wave height, allowing waves to pass virtually unobstructed through the vertical support members of the platform. When waves crest at or above the location of the topside, the platform takes a much larger load from the impact of the waves.
A secondary component of the hazard is underwater landslide, triggered by high waves in susceptible areas. These landslides can cause breakages in the underwater pipeline networks that require significant downtimes for repair and/or re-routing. Essential to the calculation of hazard is the location of the assets. The primary source of basic data regarding the fixed offshore structure and pipeline assets in the gulf is the MMS. Part of the US government, MMS maintains publicly available databases containing information including age, location and water depth for platforms and location, size and service for pipelines.
Data for mobile offshore assets, such as jack up and semi-submersible rigs, are available from commercial vendors, including information on the current location, asset type and some design detail. Location is especially important for these mobile rigs, since that will determine in large part their exposure to tropical storms and the risk to surrounding assets should they break free or fail.
Damage calculation
The susceptibility of the assets to damage is related to their details, including structure type and the design standards applicable to the design date. Damage to assets is calculated by overlaying the hazard footprint on top of the located assets.
Platform damage
There is a well established process for defining the ultimate strength of fixed offshore structures to estimate the collapse point. Using 3-D models and finite element analysis techniques, it is possible to define a load level of wind, wave and current that will collapse the structure. But this method is impractical and unsuitable for analysing each fixed platform in the gulf. Therefore, knowledge of platform types and design practices in order to group platforms and evaluate these groups is needed to design the vulnerability curves. Long history in evaluating the platforms helps in understanding how they react and how their condition changes over time.
Some other important input data to apply to the basic curves to estimate damage better are age, location and water depth, but much better definition comes from adding these other factors. In other words, you can have two platforms of the same age and in similar water depths which will have the same vulnerability curve, but you can distinguish between them with information on the number of legs and framing pattern that will define the redundancy. Another differentiating factor is air gap. With air gap data, the load level at which waves inundate the deck can be defined. Wave-in-deck loads are tremendously damaging to a platform structure, and the collapse level is reached much sooner than without deck inundation.
These basic building blocks can provide a reasonable set of vulnerability curves. Other factors can be used to enhance the curves for platform specific data:
- Condition: including corrosion, mechanical damage and previous repairs
- Installation records: pile driving information, events outside the design intent
- Platform modifications: additional deck loads, new conductors, etc.
Mobile platforms
Mobile platforms design criteria for maintaining station differ from that for fixed platforms. They are not stationary in nature and remain for short duration on a single location.
Pipelines
The connectivity analysis for pipelines is a two step process. The initial step is the calculation of physical damage to the pipeline network, shown in Figure 3. The crucial vulnerabilities occur where the pipelines come to the surface and in areas susceptible to landslide. The secondary step in the calculation of the damage to the pipelines is the connectivity analysis, which is crucial to understanding the portion of prior pipeline flow that is available following the event. The amount of residual capacity of the network following the event and the restoration period until the flows are fully restored will largely determine the extent of the loss to the network.
Indirect loss calculation
The estimation of 'loss' to the offshore energy market is a summation of the property damages plus the indirect effects of the physical damage that result in BI and CBI claims.
Business interruption
BI is a critical coverage in the offshore energy market, because of the businesses' need to insure the cash flow from their operations. It is very difficult to model because of the indirect nature of losses; the interruption to operation may occur due to physical damages on site or somewhere remote. The platform does not need to fail to trigger the coverage.
BI losses are modelled using restoration curves developed from an analysis of the entire pipeline network. Redundancies in pipeline networks create a 'non-binary' component in the analysis because some flows can be re-routed. Repair times for pipeline and/or valve interruptions can be modelled using reviews of normal maintenance on these assets and validated with storm claims data. Restoration curves showing the restoration percentage as a portion of the pre-storm capacity level can be produced for the market as a whole or for individual assets. The integration of these curves over time can produce qualified estimates of total interruptions.
Contingent business interruption
CBI was one of the most expensive causes of pay out for Ivan and Katrina. This was primarily a pipeline issue.
Pipeline network data is available in terms of:
- Connectivity
- Contents
- Lengths
- Operators
The other factors to take into consideration to define the vulnerability for this coverage are:
- Proximity to landslide areas
- Water depth
- Segment lengths
Other coverages
The other insurance coverages that need to be modelled are pollution, control of well, make-safe, re-drilling and third party liability. Most of these are direct functions of physical damage and need to be extensively validated by reference to claims data from past storms.
Conclusion
Offshore energy risk modelling is very different and more complicated compared with onshore property modelling. A large proportion of the losses in the Gulf of Mexico is due to indirect damage effects. Modelling of the indirect damages to pipelines and other networks has been performed for years in for engineering studies, and these methods can be translated to insurance risk models.
Anu Sandhu is offshore energy product manager for EQECAT. The author thanks Robert Sheppard principal engineer with ABS for his contribution to this article.
Email: ASandhu@absconsulting.com Website: www.eqecat.com

