Process management achieves results through planning and system management manages various components that must work together to achieve an objective. Here’s how the two should work, writes Adrian Clements, international enterprise risk manager
What value is risk management ultimately bringing a company? This is the fundamental question we are all asking. If it can be answered, then the role of risk manager will take on a different meaning and level of influence. This change – what it is rather than what we want it to mean – is critical to improving and clarifying the CEO´s and CFO´s understanding of what risk management really is.
For me, there are two key elements that are missing, or not rigorous enough, within most companies, regardless of size. And it might take some effort on behalf of the risk manager to discuss and extrapolate where changes in some engrained business processes are needed.
Firstly, there is an actual system of risk management being used and secondly, there is a way that this is being translated into the financial language. I specifically use the word “system” as the process of risk management should be clear. It’s the system that needs to be modified.
Risk Management System
We need a rigorous system that captures multiple parts of the business process. Including strategic reviews by management, capturing of ideas and market volatility, ensuring there are owners of implementation actions and ensuring the funding for such project actions are adequate and timely. Ultimately there needs to be a review of the action portfolio to ensure it is still aligned with the company objectives.
Apparently an elaborate and complicated process is needed. Some would say it is already there. But still the question is being asked “Why is the message not getting through?” Below I would like to present an idea of how these issues could be addressed in a simple manner. But first a quick summary of the difference between the risk management process and the risk management system.
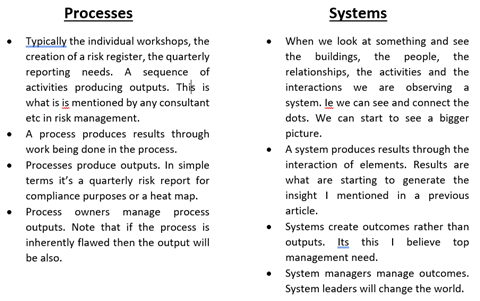
There are therefore two quite different types of management needed.
There is process management which will manage the achievement of results by planning, organising, controlling and continually improving the work required to produce them. This role can be taken up by the risk owners of each function, department etc as they are firstly managing the process needed to provide information etc. They also need to create the systems where the risk and opportunity awareness takes place within their function.
There is system management which will manage a system of interacting elements that work together to achieve an objective. These are frameworks, culture on one side but also flexibility and agility on the other. So to put all of this into a system needs something different.
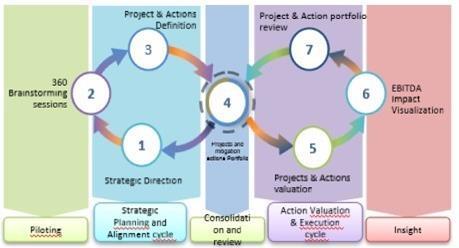
There are 2 main processes and 5 key elements to the system proposed.
Process 1: Strategy and planning.
This consists of the steps 1 to 4 and incorporates brainstorming, action definitions and modifying, influencing the strategic direction of the company.
Process 2: valuation and execution.
Steps 4 to 7 cover this process. It includes the implementation process with valuation, EBITDA impact and the portfolio review. There is one important step included which is often missed. This is insight. Failure to understand, or capture, insight leads to repeating the same mistakes and being inefficient in the use of capital employed. Resulting in a lower return of capital. Insight is created through collaboration between operations and finance in large industrial companies. To clarify and understand where value is created and where actions are really needed. Sounds easy and obvious. But is it? If you use a typical EBITDA bridge to establish which actions are needed, then I’m not so sure. I will highlight an interesting twist to this approach later in this article.
You will notice that as the system is continuous and outwards facing. Not fixed into a 12-month cycle, the use and need of traditional budgets, with their rigidity and sometime inflexibility, must be questioned. There will be a need to have a variable budgeting process to fund projects as they appear. This is step 4 where we also provide governance. This step ensures value creation is maintained and funding is only allocated to those projects adding value etc.
You will also notice that the speed of the different processes can vary. For Process 1 A major strategic review every 2-3 years will bring a longer-term brainstorming and idea capture exercise whereas a monthly brainstorming session can be used to capture faster moving market volatility.
For process 2 the speed will depend on each project and the need to review the overall portfolio of projects. This again might depend on market volatility as the window of opportunity changes.
Ultimately, regardless of which process you are in, there will be a consolidation and review process, step 4, which, as a by-product, will release the Vulnerability Timeline Assessment needed for risk review and reporting etc. It will capture the opportunities from the strategic review, the project risks and operational issues leading to erosion and reduction of EBITDA. It will also capture short- and long-term risks. Crucially it will give an idea as to level of vulnerability the individual processes have and the barriers needed to reduce vulnerability.
This system can support the identification of processes that are supporting, or affecting, the level of agility and fragility as the brainstorming, step 2, is not only conducted by top management but also operations and shop floor. Each process mentored and facilitated by the risk manager.
Financial Transposition
Step 6 generates the transparency needed within a company to enable timely decisions to be made. Timely being key when considering windows of opportunity, restricted funding, and market volatility.
The key benefit of a continuous, cyclic system is its dynamicity. Values, costs and margins can, and will, vary. Project costs and timelines will need to be updated, margins will change as economic and political risks take effect, a loss within a facility will impact profits.
Variance and volatility are firmly embedded in the world of risk management. Therefore, integrating the vulnerability mapping being produced from this system and the financial reporting would be a perfect match. As highlighted in the previous article there are several inputs and lessons learnt which we can capture from this system.
- By improving project success rate through the governance process highlighted in step 3,5 and 7 we have a higher value capture rate.
- Through lessons learnt (weak barrier identification) and tracking incident costs, we can actively reduce EBITDA Leakage
- The cyclic system proposed has several interesting advantages over other systems. Through the transparency offered:
- Additional costs needed to ensure projects are successful are automatically included in EBITDA.
- Delays are valuated and fixed and variable costs etc included in results.
- Actual, rather than budgeted, costs are used to ensure true impact is used as the baseline reference.
- Value destroying actions (from a company viewpoint) are minimised through the portfolio effect calculation of step 4.
Active idea generation, but selective project funding, means that the right ideas at the right time are being sponsored. Good ideas but wrong time, or wrong plant, are not being selected. But are being saved for later consideration. Wants, as opposed to needs, are been filtered out. As the system is focusing on reducing the level of vulnerability now then the payback on investment is faster than other systems used. Those projects being selected also have a higher success rate which all add to EBITDA stabilisation and growth.
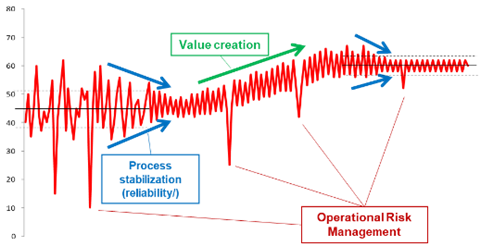
Selection of the right KPI´s is key. Most KPI´s, when achieved and then focus is removed, deteriorate over time. The main reason for this is that the barriers, people, processes in place are not sustainable. Through the correct use of KPI´s and the transparency to enable people to see where value is being lost the level of sustainability improves and we should not have to keep paying for returning the KPI back to its original value.
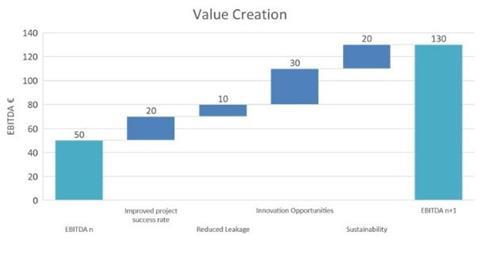
The chart below shows the value lost due to inadequate systems and processes. It is a generic one attempting to highlight where potential gains can be captured. It is not your typical financial EBITDA bridge however and we certainly don’t need to add complexity. We are turning this process and operational information into financial transparency. We need to do this simply and consistent with financial reporting fundamentals. However, the normal bridge also does not generate the transparency needed. We need to combine both in order to create the insight needed and make good sustainable management decisions.
Below is an actual EBITDA bridge taken from an actual facility. Conclusions drawn focus on exchange rate and fixed costs improvement. Operations need to become more efficient and we should spend money on a FOREX contract.
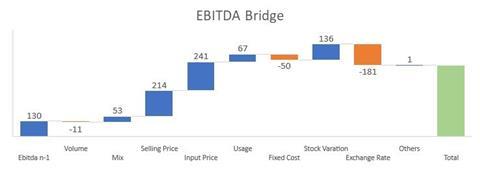
Combining the previous chart and this bridge into a performance bridge creates the transparency we need.
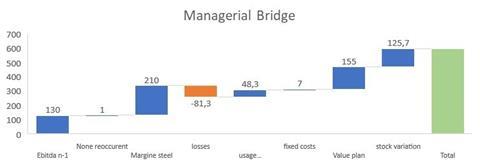
By reducing the leakage (operational losses), improving performance and creating more ideas we can significantly improve EBITDA. There appears to be no need for a FOREX contract so we can save money. Working capital variation between the two graphs is a result of operational leakage. Usage was poor due to rework, reproduction of products and possibly quality issues. All a result of the occurring incidents. These incidents are however not only the large insured ones. They are also systemic incidents and frequency issues below the radar screen. Incidents known to the shop floor but hidden to top management. The true cost of these is now becoming transparent and real solutions identified. All items not highlighted by the financial EBITDA bridge.
So the two fundamental questions raised at the beginning of this article, where does risk management add value and how to transform this into a visible value add, have been answered. The value add of a risk manager system improvement is actually threefold:
- Firstly, a system facilitating the innovation and brainstorming sessions at each level of the company to animate and capture ideas.
- Secondly, the prioritisation of which actions to focus on and implement are being analysed on a level playing field and the portfolio effect is being taken into consideration. This means the risk management system is providing more than data and information. It is providing the starting point for discussions and decisions with bias removed.
- Thirdly, silo removal, for example through partnering with the CFO, a system is enabling the likelihood of achievement of the targeted EBITDA to be increased. Or put another way. The EBITDA can be increased for a given likelihood.
This entire proposed system is reliant on a couple of things however. The ability to capture ideas and the ability to ensure the right project is done at the right time in the right place. Meaning KPI´s must be clearly structured and defined. Performance transformation therefore relies on the risk management system in place rather than the individual processes.








No comments yet