Close menu
- Home
- Risk Type
- Risk Management
- Sector Risks
- Latest Edition
- SR.500 Exchange
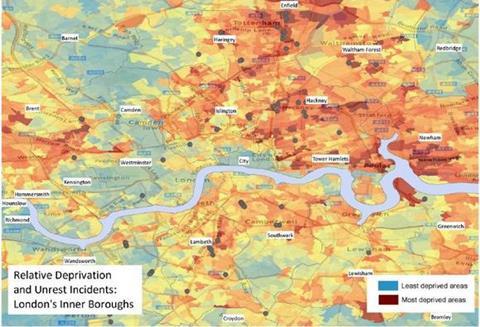
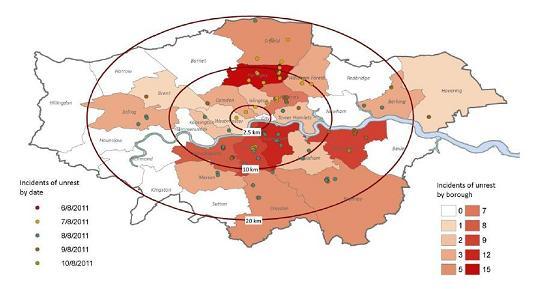
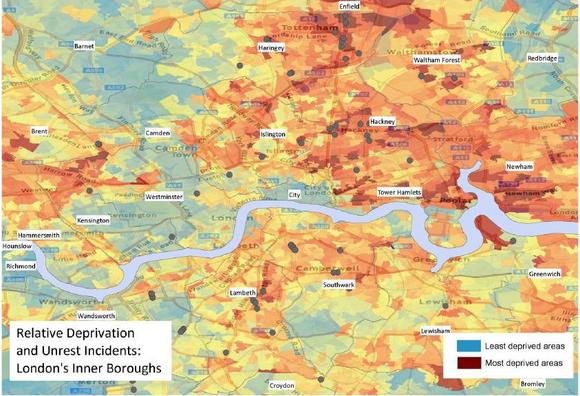
London riots: Risk maps
2011-08-19T15:26:00+01:00
Related articles
- Sign In
- Forgotten Password
- Contributors
- Feedback
- Media Pack
- © StrategicRISK 2025
Part of the Insurance and Risk group of
Newsquest Specialist Media
Newsquest Specialist Media
Published by Newsquest Media Group Limited,
registered in England & Wales with number 01676637
at The Echo Building, 18 Albert Road, Bournemouth,
England, BH1 1BZ - a Gannett company
registered in England & Wales with number 01676637
at The Echo Building, 18 Albert Road, Bournemouth,
England, BH1 1BZ - a Gannett company
Site powered by Webvision Cloud


